
What will London look like by 2035? Very different to how it looks today – that much is certain. It also seems certain that in the years between 2016 and 2035 we will need to make difficult and complex decisions about our built environment.
This week alone the topic has hit the headlines as new London Mayor Sadiq Khan said he wants 50 per cent of all new homes in London to be affordable whilst the Skyline Campaign and a number of architects called for a six-month moratorium on tall buildings in the capital.
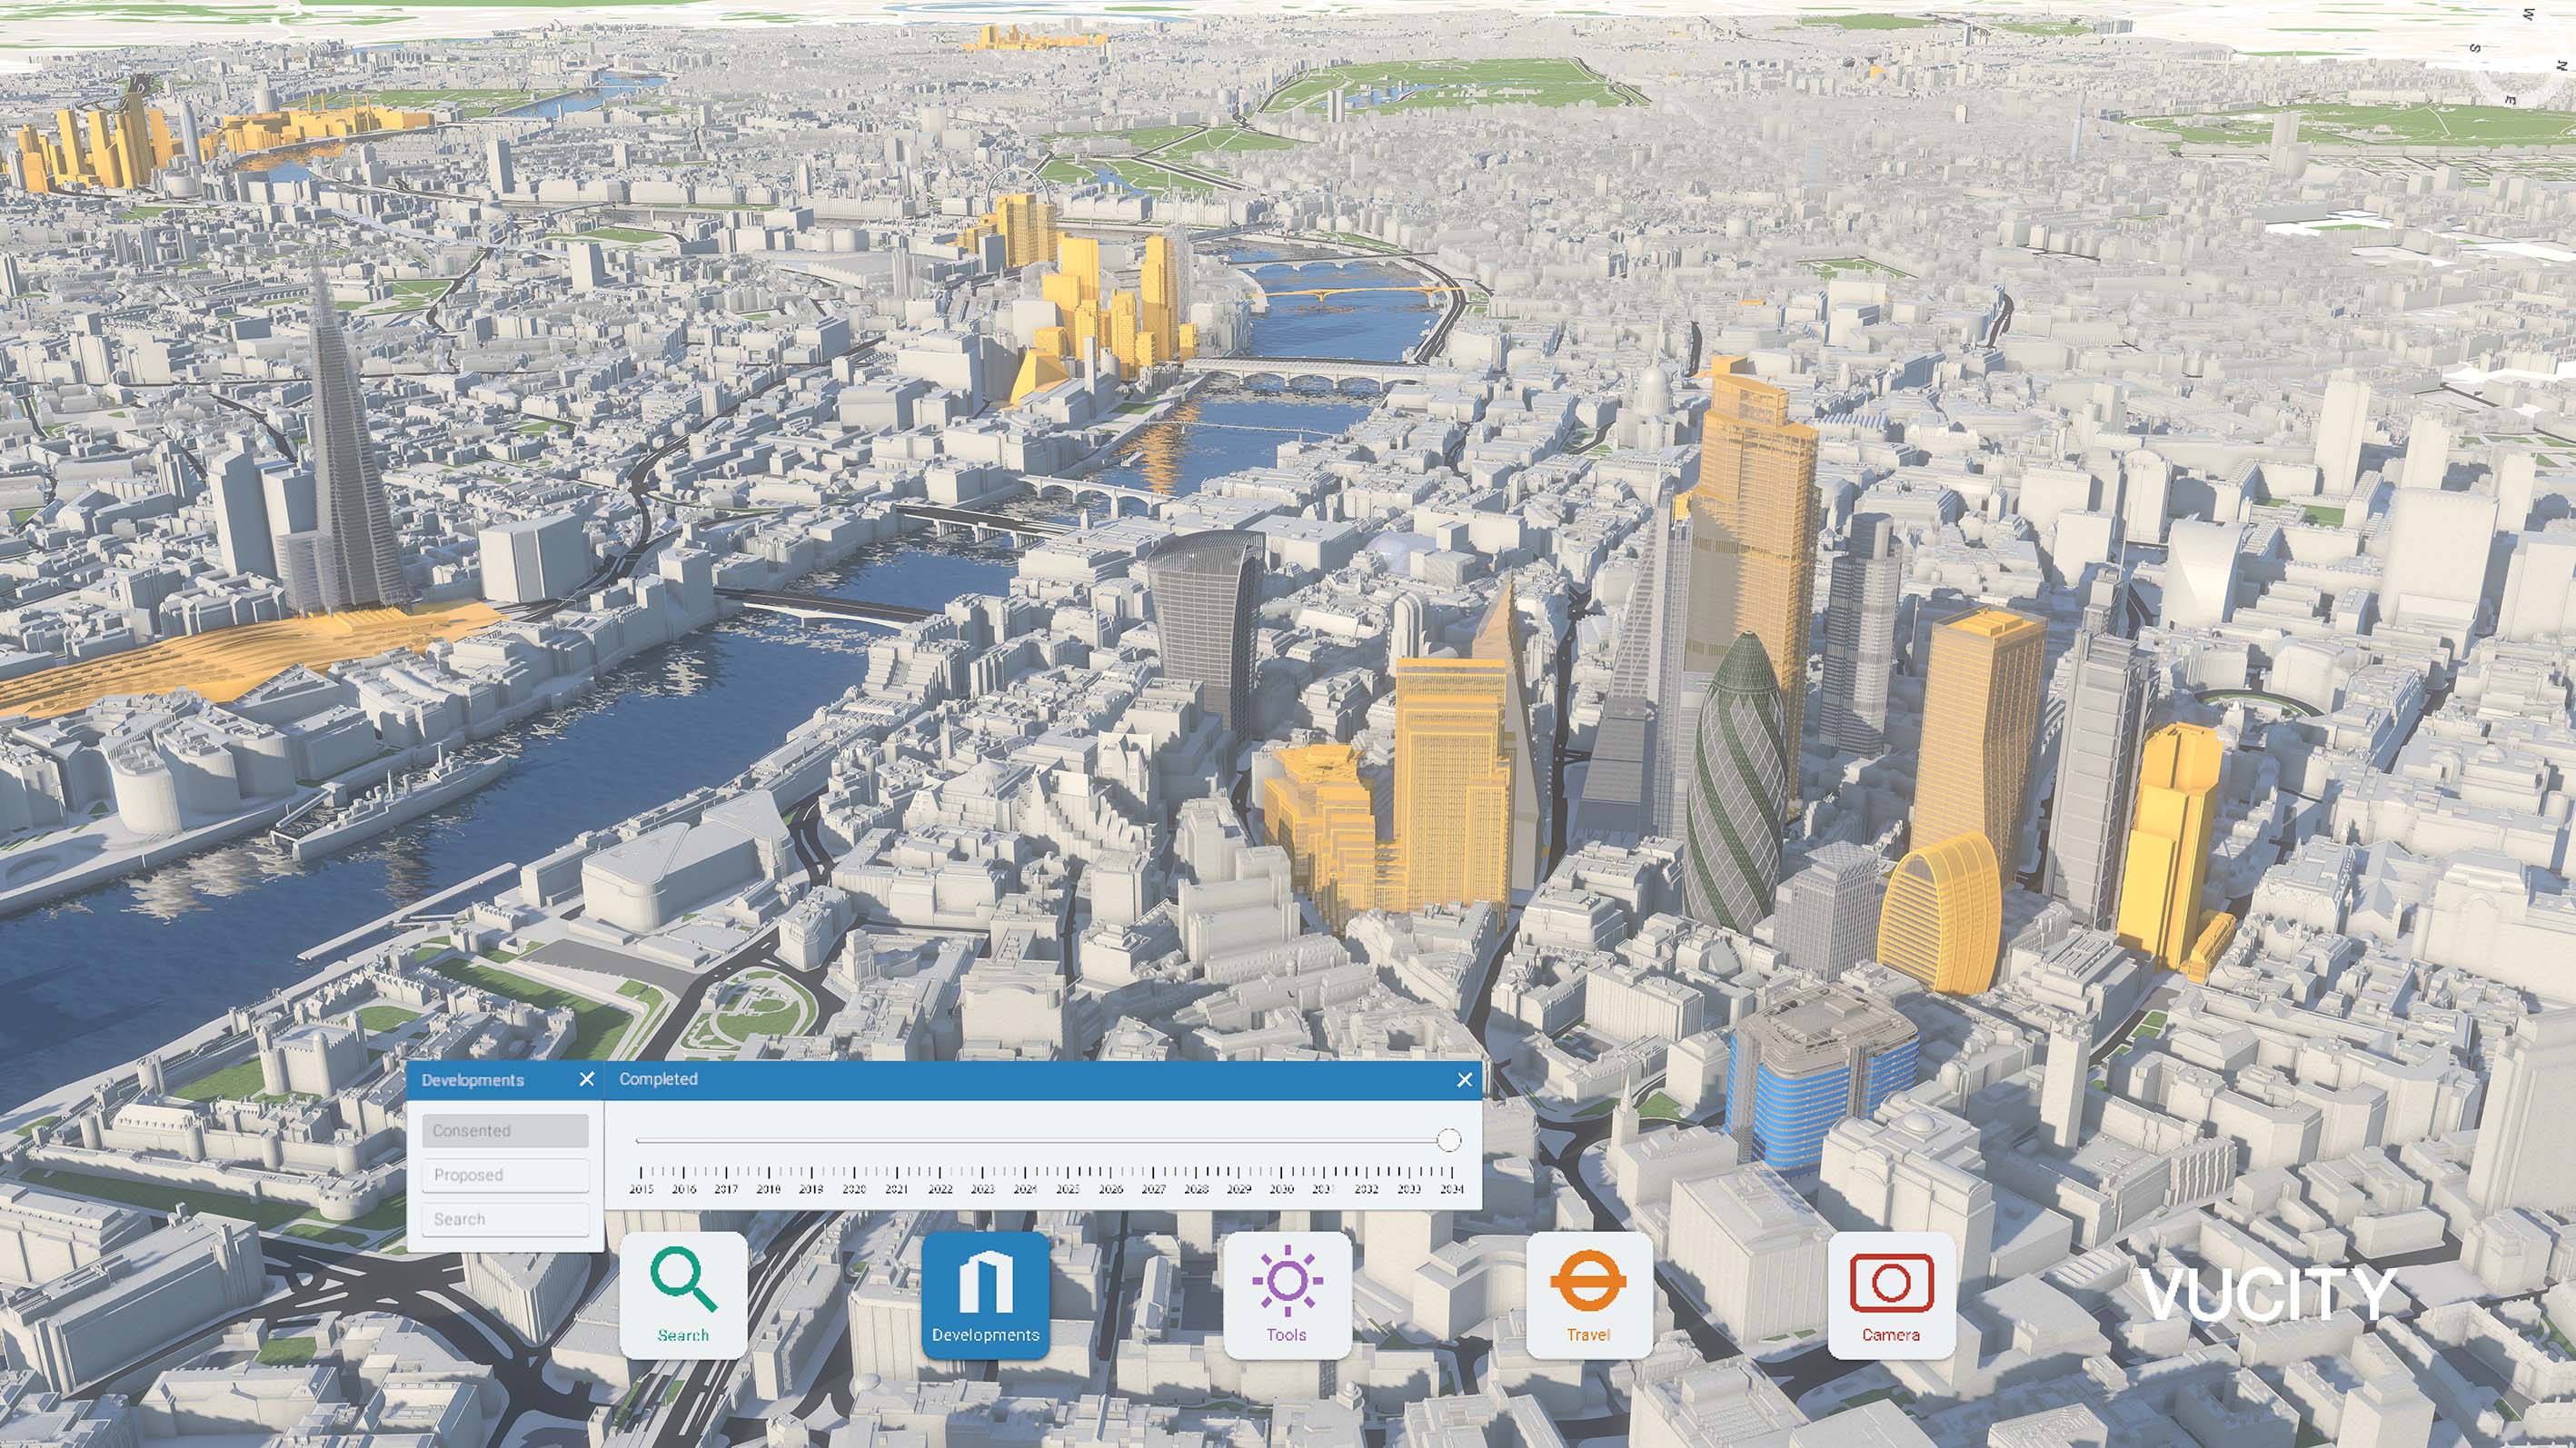
Where will new homes go? Should tall towers be built? These and others are questions that VU.CITY – London’s first fully interactive digital model - helps us answer, and this week the team behind VU.CITY has been speaking at the Geo Business Show, giving us a glimpse of what London may look like by 2035.
VU.CITY uses ground-breaking technology to offer London’s developers, planners, architects and Boroughs a visual tool to assist in future proofing London’s built environment, transforming the planning and communication process around new developments, at a macro level.
It currently covers 150 square kilometres across five central London Boroughs: Hammersmith and Fulham, Kensington & Chelsea, Westminster, The City and Tower Hamlets. A further 20 km sq is currently under production as the team captures Camden and Southwark, and updates existing areas from the latest 2015 imagery.
As a result of the technology, it is possible to capture other cities very quickly too, using photogrammetry as the main geospatial mapping tool.
The VU.CITY dashboard includes information on sunlight paths, transport routes, LVMF and riverside protected views. By inserting camera points into the model at ground level, the user is able to complete preliminary assessments on verified view requirements, creating a more efficient route through the planning process.
It not only accurately shows the current built environment, but also allows users to toggle between existing, consented and proposed developments, showing the development pipeline in London and helping to establish what the future city might look like. In one interactive model it is possible to understand the impact of development clusters across London, from the City and Blackfriars, to the Isle of Dogs and King’s Cross.
Informing future debate
It is this ability to model the future that the team will be highlighting at Geo Business, and which is so anticipated by delegates, many of whom work in organisations that collect vast swathes of useful data, but to date have been unable to make that data meaningful. At its core, that is what VU.CITY does: it helps us visualise large, complex data sets, making sense of them and so enabling us to make better informed decisions.
By visualising London in 3D, and giving the ability to integrate data digitally, VU.CITY is the key to unlocking how we tackle future development and infrastructure planning. VU.CITY creates an informed debate, for better decision-making at all stages from tendering to planning to design to building to sales and marketing. Most critically it will contribute to a better built environment for London’s population today and in the decades ahead.
Recent Comments